
Chapter 9 – Section 1
National and New Jersey DUI Statistics
MADD is one of many groups committed to preventing drunk driving.
Driving statistics show the devastating effects that alcohol has on a person’s ability to operate a motor vehicle. The following statistics on alcohol-impaired driving are from the National Highway Traffic Safety Administration (NHTSA) and are for the U.S. in 2010:1
- Alcohol-impaired-driving crashes killed 10,228 people. These alcohol-impaireddriving fatalities accounted for 31% of total motor vehicle traffic fatalities.
- An average of one alcohol-impaired-driving fatality occurred every 51 minutes.
- Of the 10,228 people who died in alcohol-impaireddriving crashes, 6,627 (65%) were drivers with a BAC (blood alcohol concentration) of .08% or higher. The remaining fatalities consisted of 2,872 (28%) motor vehicle occupants and 729 (7%) nonoccupants.
- Of drivers with a BAC level of .08% or higher involved in fatal crashes, the highest percentage was motorcycle drivers (28%), followed by passenger car drivers (23%) and light truck drivers (22%). The percentage of drivers with BAC levels of .08% or higher in fatal crashes was the lowest for large truck drivers (2%).
- Of the crash fatalities among children ages 14 and younger, 17% occurred in alcohol-impaireddriving crashes. Out of those children killed, 62% were passengers of a vehicle with a driver who had a BAC of .08% or higher. Twelve percent were pedestrians or pedal cyclists who were struck by drivers with a BAC of .08% or higher.
- The risk of being involved in an alcohol-impaired-driving crash is greater for young people than for older people. Of drivers with a BAC level of .08% or higher involved in fatal crashes, the highest percentage was drivers ages 21 to 24 (34%), followed by drivers ages 25 to 34 (30%) and drivers ages 35 to 44 (25%).
- Teen drivers are disproportionately involved in alcohol-related crashes.2 In 2010 in the U.S., 30% of the young drivers ages 15 to 20 years old who were killed in motor vehicle crashes had a BAC (blood alcohol concentration) of .01% or higher.Twenty five percent of young drivers killed had a BAC of .08% or higher.3 Alcohol is a factor in 37% of traffic deaths among people 16 to 20 years old.4
- The rate of alcohol impairment among drivers involved in fatal crashes was four times higher at night than during the day (37% versus 9%).
- The percentage of drivers involved in fatal crashes who were alcohol impaired was 16% during the week, compared to 31% on weekends.
- Of drivers involved in speeding-related fatal crashes, 42%had a BAC of .08% orhigher.
- Impaired drivers are less likely to use seat belts.Seventy percent of the 5,189 impaired passenger vehicle drivers killed (with a BAC of .08% or higherand for which restraint use was known) were not using seatbelts.
- 6,652 (58%) of alcohol-impaired drivers involved in fatal crashes had a BAC of .15% or greater.
Here are further statistics on alcohol-impaired driving:
- In 2011 in New Jersey,there were 586 fatal crashes with 627 people killed. Of the fatalities, 31.1% had consumed alcohol to some extent.5
- In 2009 in the U.S., over 1.4 million drivers were arrested for driving under the influence of alcohol or narcotics. That is less than 1% of the 147 million incidents of alcohol-impaired driving self-reported by U.S. adults each year.6
- Drugs other than alcohol (such as marijuana and cocaine) are involved in about 18% of motor vehicle driver deaths. These other drugs are often used in combination with alcohol.7
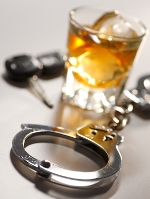
- Impaired driving is the most frequently committed crime in the United States.8
- Alcohol-related injuries are a serious threat to both drivers and passengers on the road. Alcohol and drugs are a factor in 20% of all collisions resulting in injuries9
- About 3 in every 10 Americans will be involved in an alcohol-related crash at some time in their lives.10
- Alcohol-related crashes are estimated to cost the public more than $50 billion yearly.11
- If a driver has reached a BAC of slightly above .05% after drinking, therisk for causing a motor vehicle accident doubles. The risk is six times as greatwhen driving with a BAC of .10%. The risk is 25 times as great whendriving with a BAC of .15%.12
Positive Statistics
- Traffic fatalities in alcohol-impaireddriving crashes decreased by 4.9% from 10,759 in 2009 to 10,228 in 201013
- NHTSA estimates that the 21-year-old minimumdrinkingage laws have reduced alcohol-impaired traffic fatalities by 13% and have saved an estimated 28,230 lives since 1975. In 2010, minimum drinking age laws saved an estimated 550 lives.14
- The number of young drivers involved in fatal crashes who had a BAC of .01% or higher dropped by 46%, from 1,885 in 2001 to 1,025 in 2010. 15
- Due to minimum drinking age laws, lower BAC laws, and activist groups such as MADD and SADD, countless lives are being saved each year. By educating our children on the dangers of drinking and driving, we should be able to lower the number of impaired driving incidents even more.
Impaired Driving on Holidays
On Christmas and New Year’s, two to three times more people die in alcohol-related crashes than in comparable time periods during the rest of the year. During these holidays, 40% of traffic fatalities involve a driver who is alcohol-impaired compared to 28% for the rest of December.16
However, Thanksgiving is the most dangerous holiday of the year for drivers.17 On Thanksgiving, the combination of drinking, heavy traffic, and long-distance car trips leads to potentially fatal travel conditions. Independence Day is the second most dangerous holiday because of heavy drinking and the high number of people traveling on vacation in midsummer. On Independence Day, almost 41 million people are on the roads and impaired driving causes over 50% of all traffic collisions.18
Memorial Day and Labor Day are the number 3 and 4 most dangerous holidays of the year.19 This is because people tend to drink on holidays and they also travel by car more on long weekends. Increased drinking and heavy traffic raise the risk of traffic collisions on Memorial Day and Labor Day. Thanksgiving, Memorial Day and Labor Day always fall on three- or four-day weekends.
Travelers are also at risk on single-night holidays like New Year’s Eve and Halloween, which are the number 5 and 6 most dangerous holidays.20 Holidays that fall on a Friday or Saturday are especially dangerous because people tend to drink more on weekend holidays.
There is a tendency for drivers to relax during holidays. According to the British humorist Jonathan Miller, the holidays are an expensive test of strength. The mind is at ease, and thoughts are on upcoming festivities. However, statistics show that holidays are the most dangerous times to be on the road. More people are drinking alcohol, more vehicles are on the road, there are more distractionssuch as children in the vehicle, and the overall driving task is made more difficult.
Statistics don’t lie… Alcohol, motor vehicles, and people don’t mix! Jim Carrey plays an attorney who is suddenly unable to lie in the film Liar Liar.
Video: “Drunk Driver”
The statistics cited above are only one way to demonstrate how impaired driving threatens our safety. The following video describes the impact of impaired driving and shows how to avoid an impaired driver.
You do not want to encounter an impaired driver, especially on the highway. Be sure to stay alert for possible impaired drivers so you do not become a victim.
1 National Highway Traffic Safety Administration (NHTSA). (April 2012). Traffic Safety Facts 2010 Data Alcohol-Impaired Driving. DOT HS 811 606. Retrieved from http://www-nrd.nhtsa.dot.gov/Pubs/811606.pdf
2Mann, Denise. (July 19, 2012). Top 10 Safest & Most Dangerous Cities to Drive In Car, Crashes Are Leading Cause of Death Among U.S. Teens and Young Adults. WebMD. Retrieved from http://women.webmd.com/news/20120719/top-10-safest-and-most-dangerous-cities-drive-in?redirect=/news/20120719/top-10-safest-and-most-dangerous-cities-drive-in&_referer_=earthlink.webmd.com&orig_qs
3National Highway Traffic Safety Administration (NHTSA). (May 2012). Traffic Safety Facts 2010 Data Young Drivers. DOT HS 811 622. Retrieved from http://www-nrd.nhtsa.dot.gov/Pubs/811622.pdf
4National Institutes of Health. (February 14, 2011). Alcohol-Related Traffic Deaths. Retrieved from http://report.nih.gov/NIHfactsheets/ViewFactSheet.aspx?csid=24
5New Jersey State Police. (2011). Fatal Motor Vehicle Crash Comparative Data Report for the State of New Jersey. Page 1. Retrieved from http://www.state.nj.us/lps/njsp/info/fatalacc/2011_fatal_crash.pdf
6CDC Centers for Disease Control and Prevention. (n.d.) Injury Prevention & Control: Motor Vehicle Safety. Impaired Driving: Get the Facts. Retrieved from http://www.cdc.gov/Motorvehiclesafety/Impaired_Driving/impaired-drv_factsheet.html
7CDC Centers for Disease Control and Prevention. (n.d.) Injury Prevention & Control: Motor Vehicle Safety. Impaired Driving: Get the Facts. Retrieved from http://www.cdc.gov/Motorvehiclesafety/Impaired_Driving/impaired-drv_factsheet.html
8CA Dept. of Alcohol and Drug Programs. (August 2004). Fact Sheet: Driving-Under-the-Influence (DUI) Frequently Asked Questions. Retrieved from https://www.mhn.com/static/pdfs/Driving_Under_the_Influence_Frequently_Asked_Questions.pdf
9CA Dept. of Alcohol and Drug Programs. (August 2004). Fact Sheet: Driving-Under-the-Influence (DUI) Frequently Asked Questions. Retrieved from https://www.mhn.com/static/pdfs/Driving_Under_the_Influence_Frequently_Asked_Questions.pdf
10CA Dept. of Alcohol and Drug Programs. (August 2004). Fact Sheet: Driving-Under-the-Influence (DUI) Frequently Asked Questions. Retrieved fromhttps://www.mhn.com/static/pdfs/Driving_Under_the_Influence_Frequently_Asked_Questions.pdf
Transportation Safety. (n.d.) Alcohol-related Crashes. Retrieved from http://safety.transportation.org/htmlguides/ARcrashes/section01.htm
12The New Jersey Motor Vehicle Commission. (February 2011). The New Jersey Driver Manual. Page 103. Retrieved from http://www.state.nj.us/mvc/pdf/Manuals/drivermanual.pdf
13National Highway Traffic Safety Administration (NHTSA). (April 2012). Traffic Safety Facts 2010 Data Alcohol-Impaired Driving. DOT HS 811 606. Retrieved from http://www-nrd.nhtsa.dot.gov/Pubs/811606.pdf
14National Highway Traffic Safety Administration (NHTSA). (May 2012). Traffic Safety Facts 2010 Data Young Drivers. DOT HS 811 622. Retrieved from http://www-nrd.nhtsa.dot.gov/Pubs/811622.pdf
15National Highway Traffic Safety Administration (NHTSA). (May 2012). Traffic Safety Facts 2010 Data Young Drivers. DOT HS 811 622. Retrieved from http://www-nrd.nhtsa.dot.gov/Pubs/811622.pdf
16National Institute on Alcohol Abuse and Alcoholism. (December 2011). New Year, Old Myths, New Fatalities: Alcohol-Related Traffic Deaths Jump on Christmas and New Year’s. Retrieved from http://pubs.niaaa.nih.gov/publications/RethinkHoliday/NIAAA_NYE_Fact_Sheet_2011.pdf
17Detwiler, Jacqueline. (November 26, 2008). Dangerous Driving Holidays. Forbes.com. Retrieved from http://www.forbes.com/2008/11/06/dangerous-driving-holidays-forbeslife-cx_jd_1106travel.html
18Detwiler, Jacqueline. (November 26, 2008). Dangerous Driving Holidays. Forbes.com. Retrieved from http://www.forbes.com/2008/11/06/dangerous-driving-holidays-forbeslife-cx_jd_1106travel.html
19Detwiler, Jacqueline. (November 26, 2008). Dangerous Driving Holidays. Forbes.com. Retrieved from http://www.forbes.com/2008/11/06/dangerous-driving-holidays-forbeslife-cx_jd_1106travel.html
20Detwiler, Jacqueline. (November 26, 2008). Dangerous Driving Holidays. Forbes.com. Retrieved from http://www.forbes.com/2008/11/06/dangerous-driving-holidays-forbeslife-cx_jd_1106travel.html